Personal Portfolio & Admin Dashboard
Full-stack platform with admin dashboard, IoT energy monitoring via MQTT and TimescaleDB, and a React Native companion mobile app. Features RBAC, real-time SSE/WebSocket streaming, and content management.
title: "Personal Portfolio & Admin Dashboard" description: "Full-stack platform with admin dashboard, IoT energy monitoring via MQTT and TimescaleDB, and a React Native companion mobile app. Features RBAC, real-time SSE/WebSocket streaming, and content management." technologies:
- Next.js 16
- React 19
- TypeScript
- Tailwind CSS
- Shadcn/UI
- TanStack Query
- TanStack Form
- TanStack Table
- Zustand
- Zod
- Framer Motion
- Feature-Sliced Design
- Go
- Gin
- GORM
- PostgreSQL
- TimescaleDB
- Redis
- MQTT
- WebSocket
- SSE
- JWT
- Asynq
- Docker
- React Native thumbnail: "/images/projects/personal-portfolio-admin-dashboard/thumbnail.webp" demo: "https://lehadegalego.com" date: "2024-12-09" featured: true
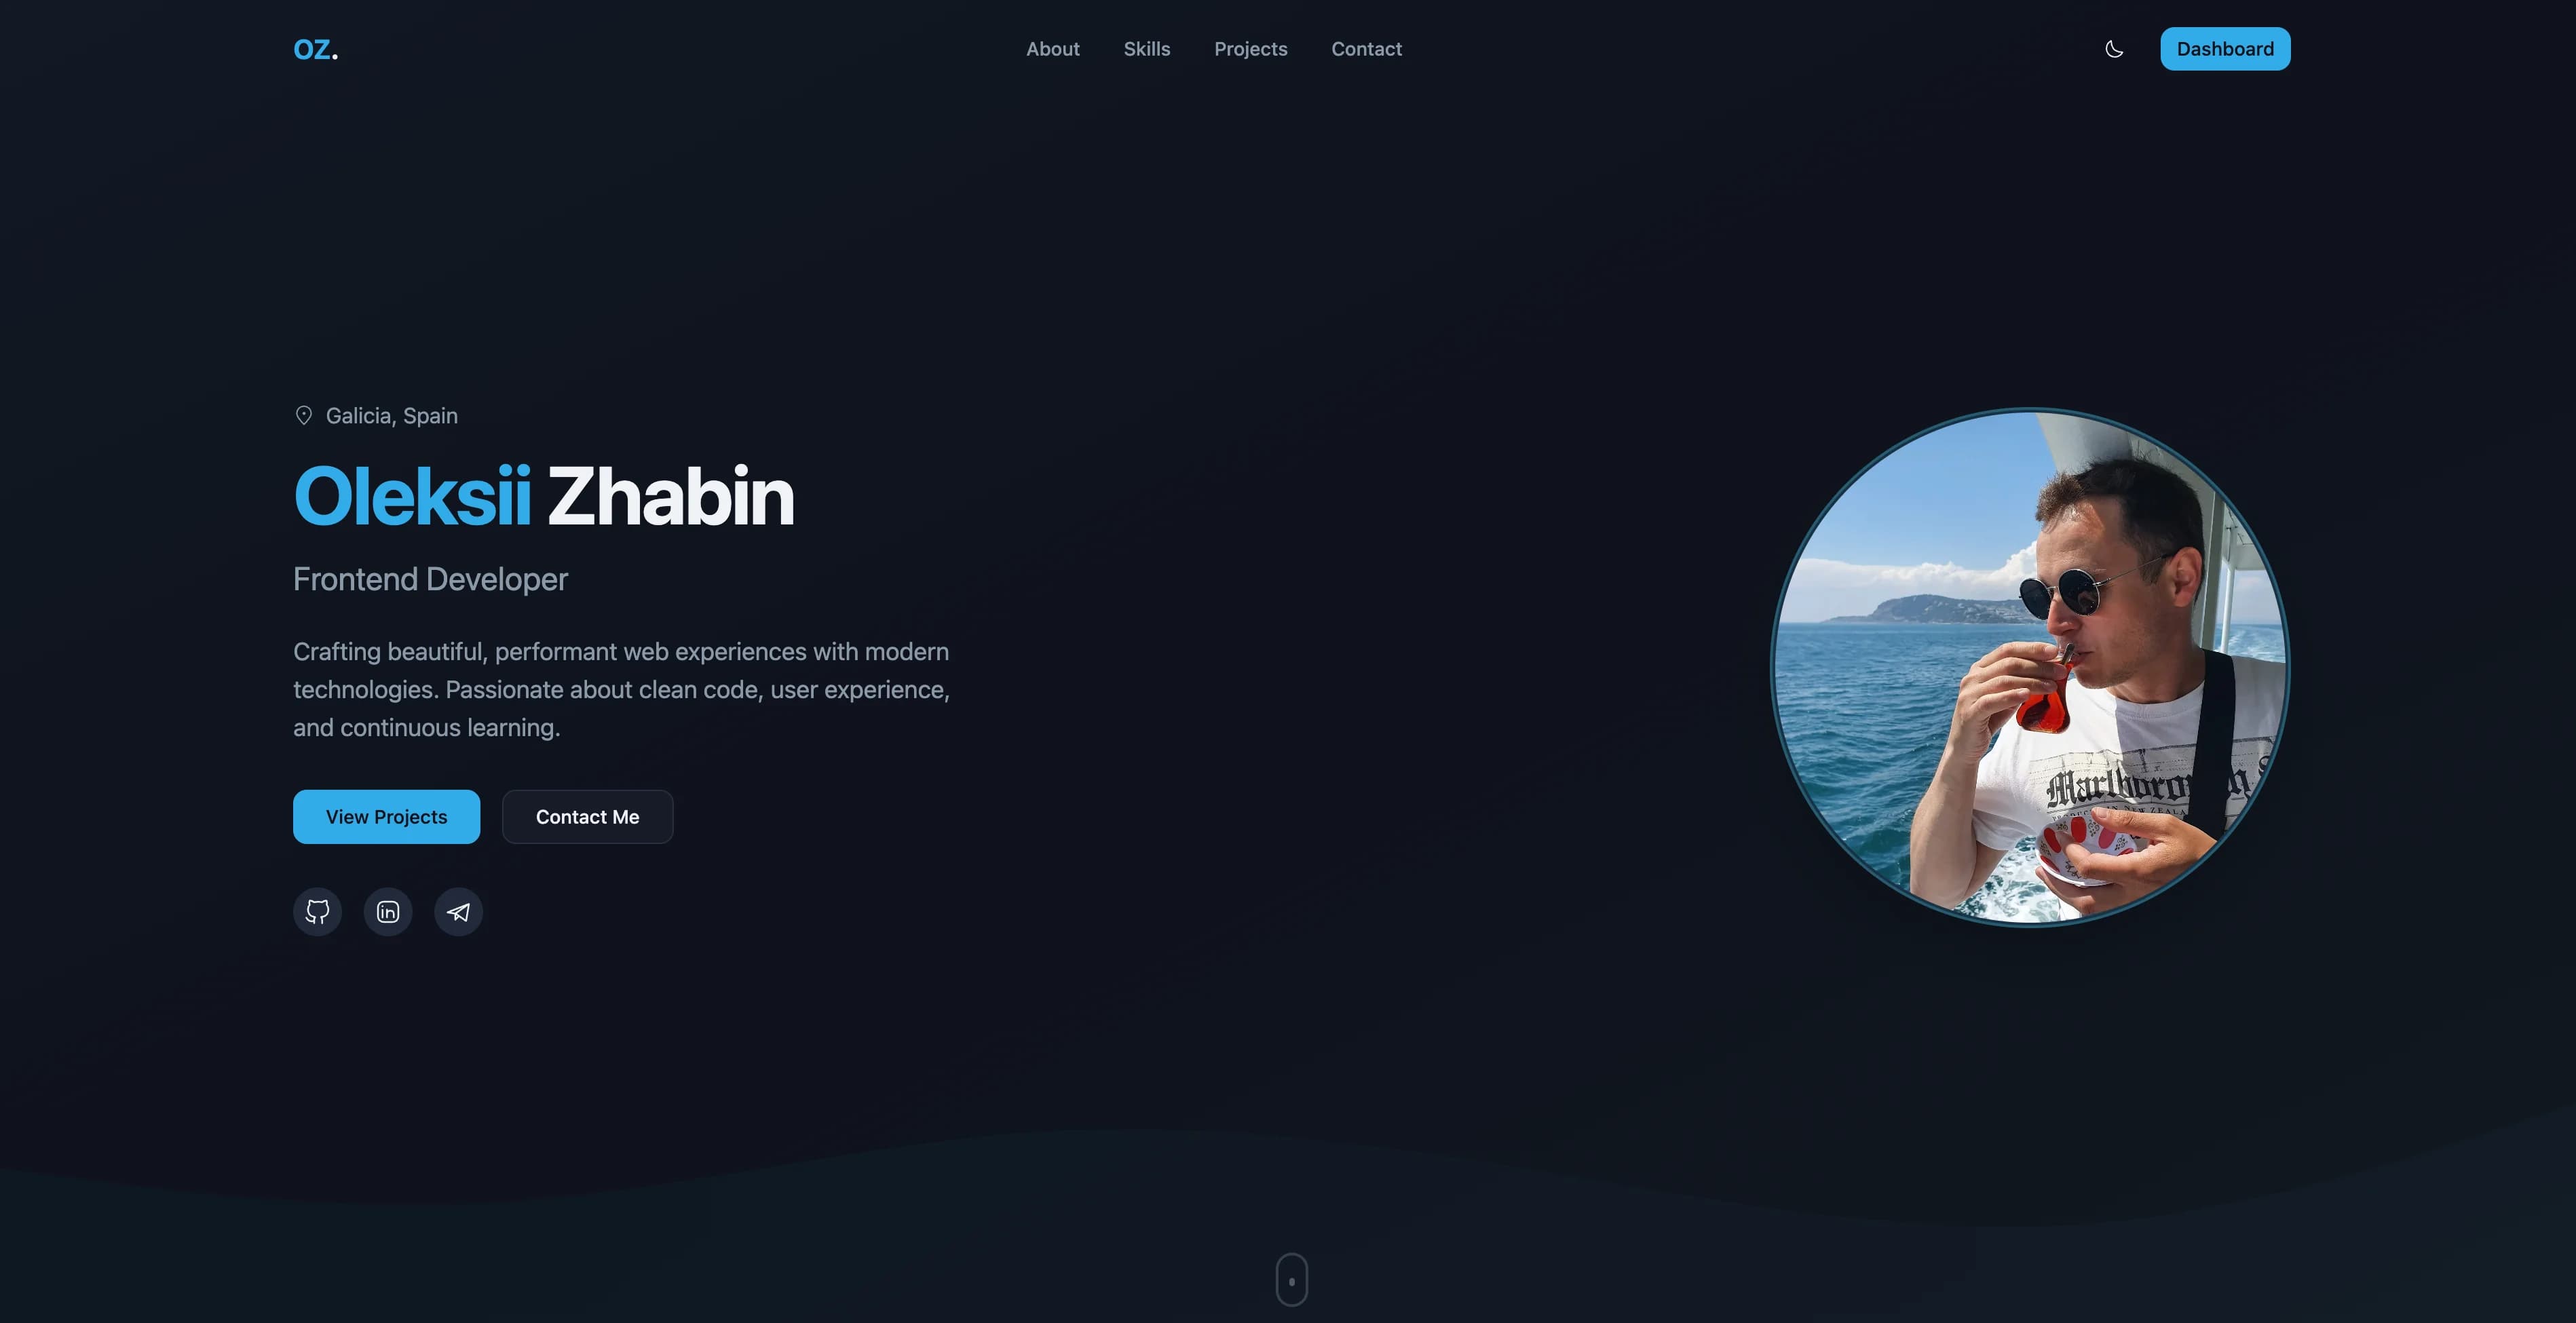
Overview
This project started as a personal portfolio but evolved into a full-stack platform with four major parts: a public-facing portfolio website, a comprehensive admin dashboard, an IoT energy monitoring system connected to a Shelly Pro EM 50A smart meter, and a React Native companion mobile app for real-time energy data on the go.
The Challenge
I needed a portfolio that wasn't just a static showcase, but a living platform where I could:
- Manage content without touching code
- Handle client inquiries efficiently
- Control who has access to what features
- Receive real-time notifications about new inquiries
- Monitor home energy consumption with IoT hardware
- Access energy data on the go from a mobile device
Solution Architecture
Frontend
The frontend is built with Next.js 16 and React 19 using Feature-Sliced Design architecture for scalable code organization. The UI is crafted using Shadcn/UI components with Tailwind CSS and Turbopack for fast development builds.
Key Features
- React Server Components with App Router
- Feature-Sliced Design for scalable architecture
- Responsive design for all devices
- Dark/light theme support
- Smooth animations with Framer Motion
- Type-safe forms with TanStack Form + Zod validation
Backend
The backend is written in Go with the Gin framework and GORM ORM. It uses PostgreSQL for data persistence, Redis for caching, and implements JWT authentication with HTTP-only session cookies.
Backend Features
- Gin framework with structured middleware and routing
- GORM with auto-migrations and query optimization
- Redis caching for frequently accessed data
- Asynq background workers for image conversion to WebP
- Swagger API documentation auto-generated from code
- Docker Compose for local development and deployment
Energy Monitoring / IoT
The platform integrates with a Shelly Pro EM 50A smart energy meter via MQTT. Energy readings are stored in TimescaleDB (a PostgreSQL extension for time-series data) and streamed to clients in real-time via SSE and WebSocket.
Energy Stack
- MQTT subscriber receiving readings from Shelly Pro EM 50A
- TimescaleDB hypertables with continuous aggregates for hourly/daily rollups
- Automatic compression policies for historical data
- Dual-channel monitoring: voltage, current, active/apparent power, power factor, frequency
- SSE for dashboard widgets, WebSocket for live mobile streaming
- Public API endpoints for energy data access
Mobile App
A React Native 0.84 companion app provides a live energy monitoring dashboard on iOS and Android.
Mobile Features
- Live WebSocket connection with automatic reconnection and exponential backoff
- Real-time rolling 5-minute charts with gifted-charts
- Reanimated animations for smooth UI transitions
- Historical data with period selectors (day/week/month)
- JWT authentication with Zustand persisted state
- Dark mode with system theme detection
State Management
Client state is managed with Zustand for its simplicity and performance. Server state is handled by TanStack Query, providing caching, background refetching, and optimistic updates.
Key Features
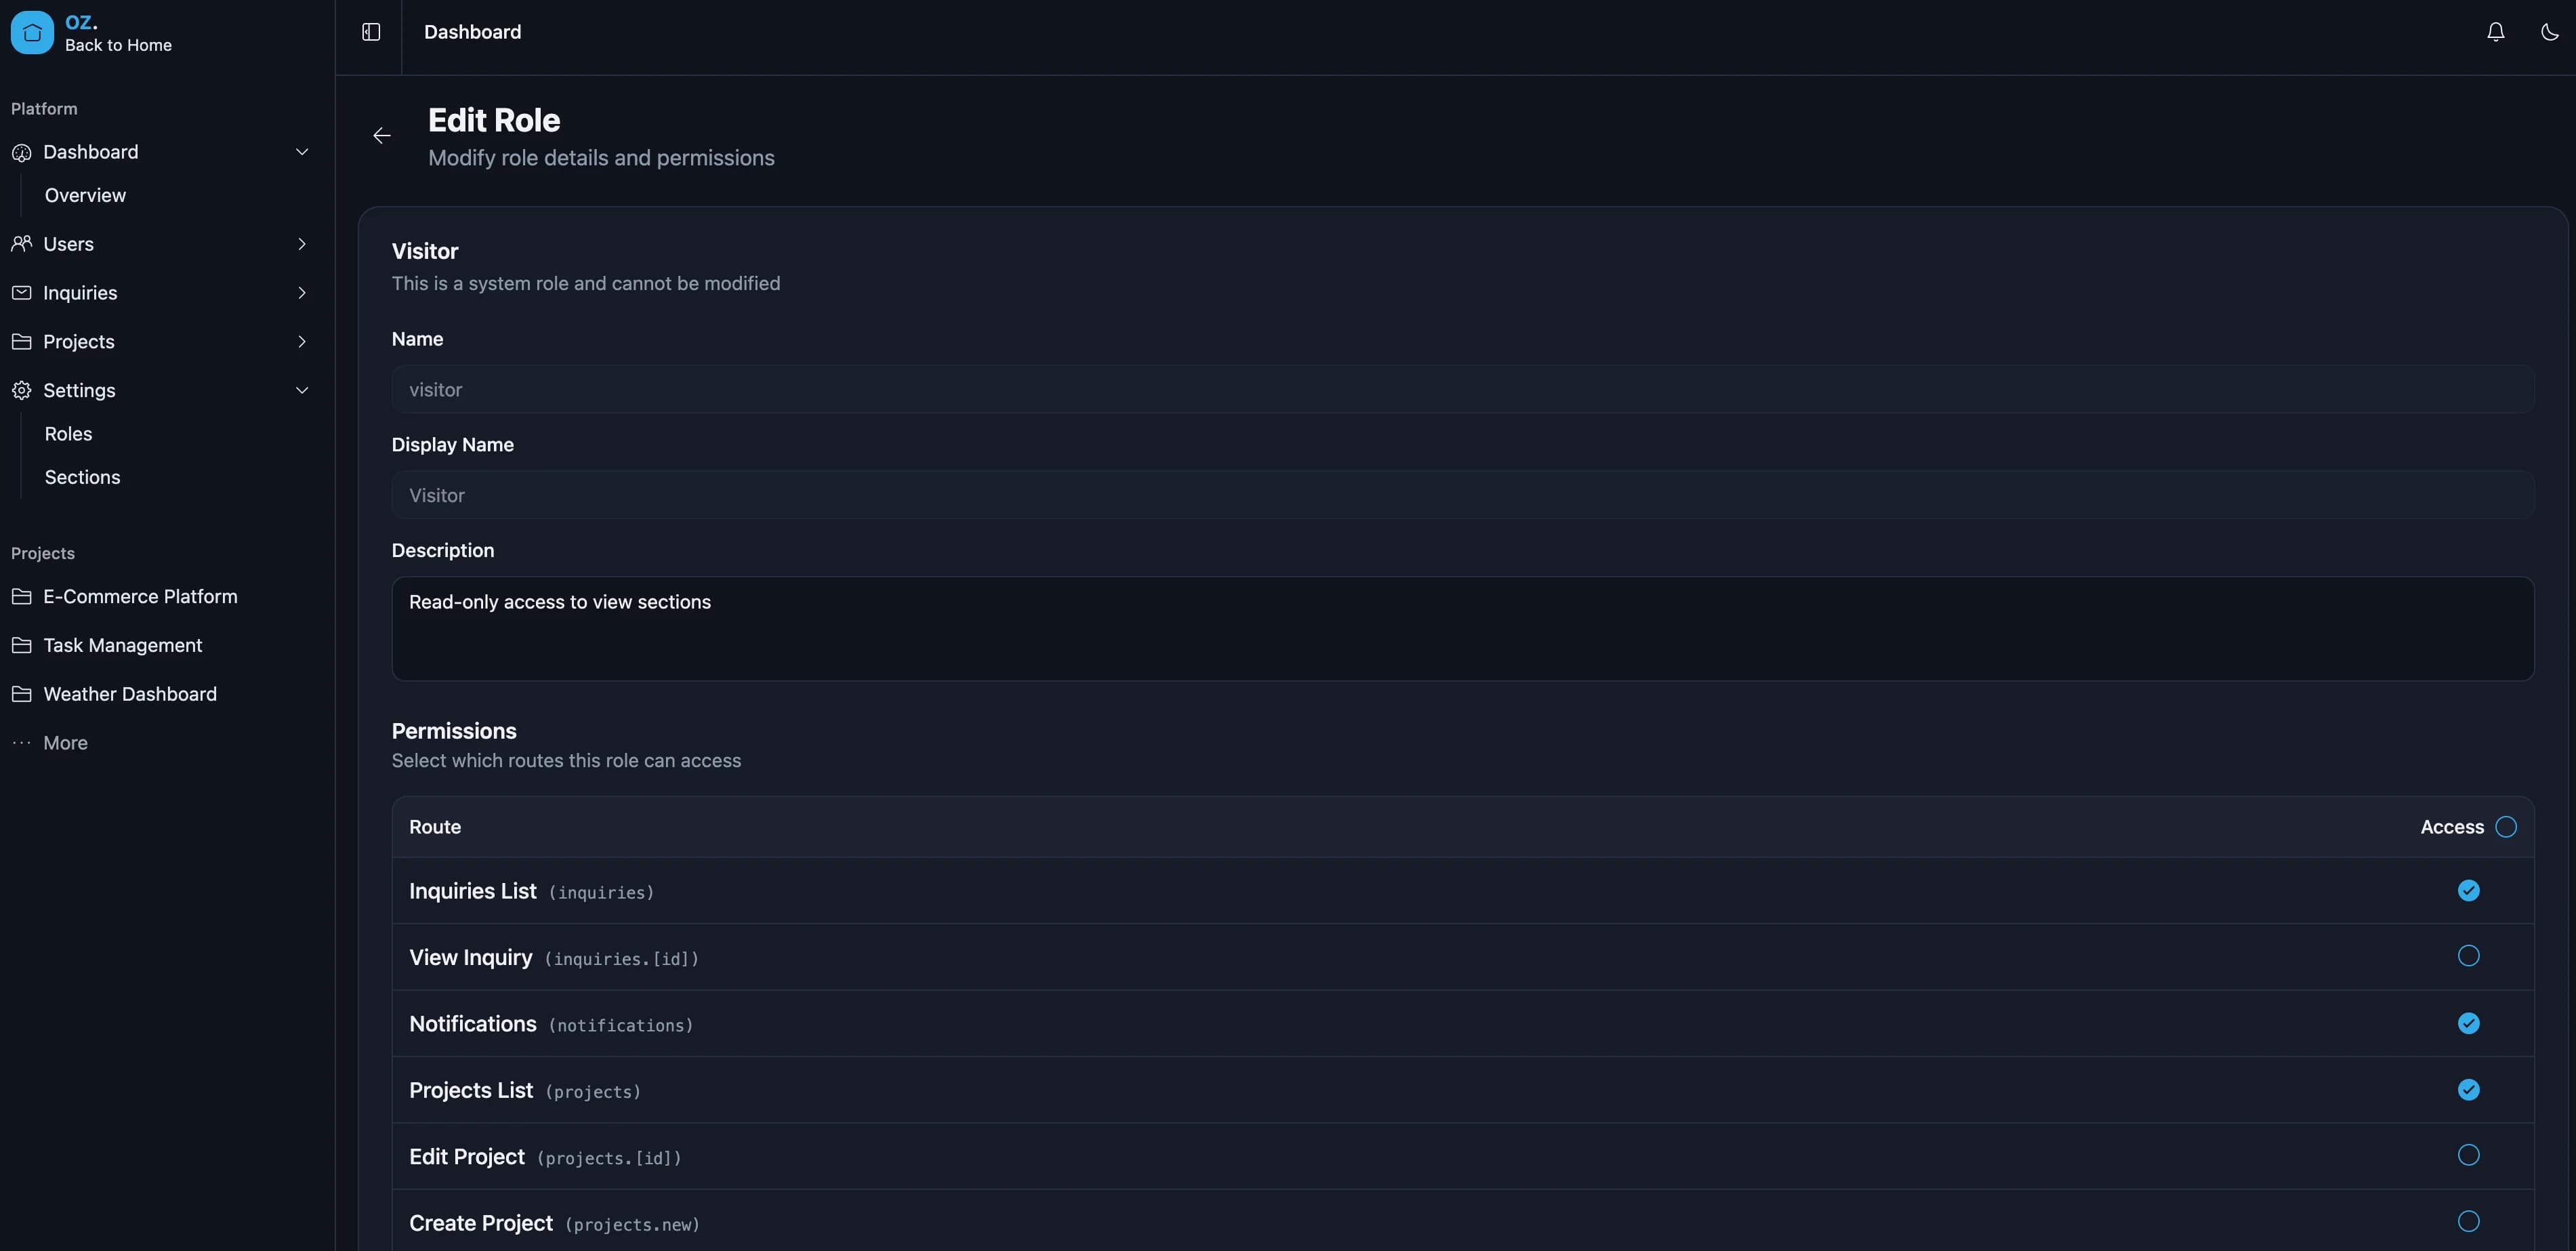
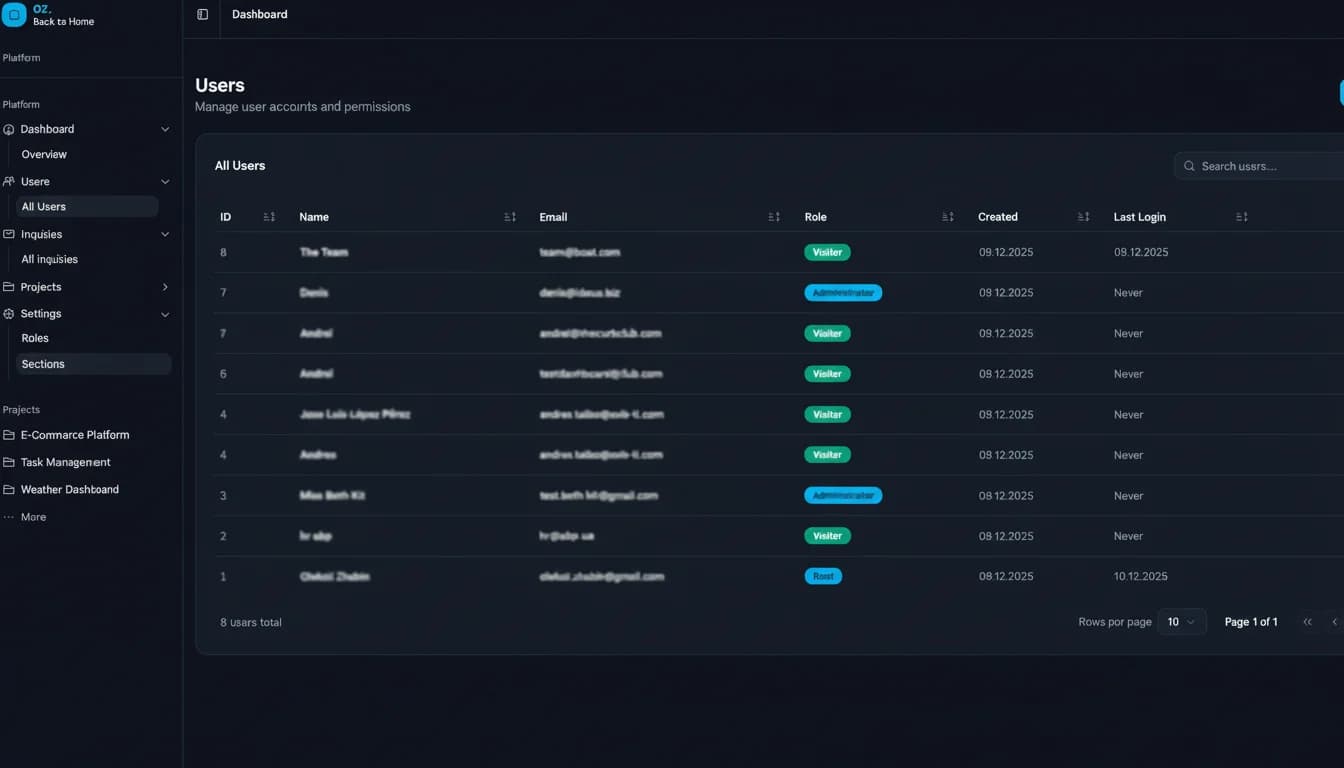
Role-Based Access Control (RBAC)
One of the most complex features is the granular permission system. Instead of simple role-based checks, the system allows configuring access at the route level:
// Each route is a "section" with its own permission
const sections = [
  "users",           // /dashboard/users
  "users.new",       // /dashboard/users/new
  "users.[id]",      // /dashboard/users/:id
  "settings.roles",  // /dashboard/settings/roles
  // ...
];

// Check access
function canAccess(user: IUser, section: string): boolean {
  return user.role.permissions.some(
    (p) => p.section_name === section && p.can_access
  );
}
This approach allows for very fine-grained control. For example, a user could have access to view the users list but not create new users.
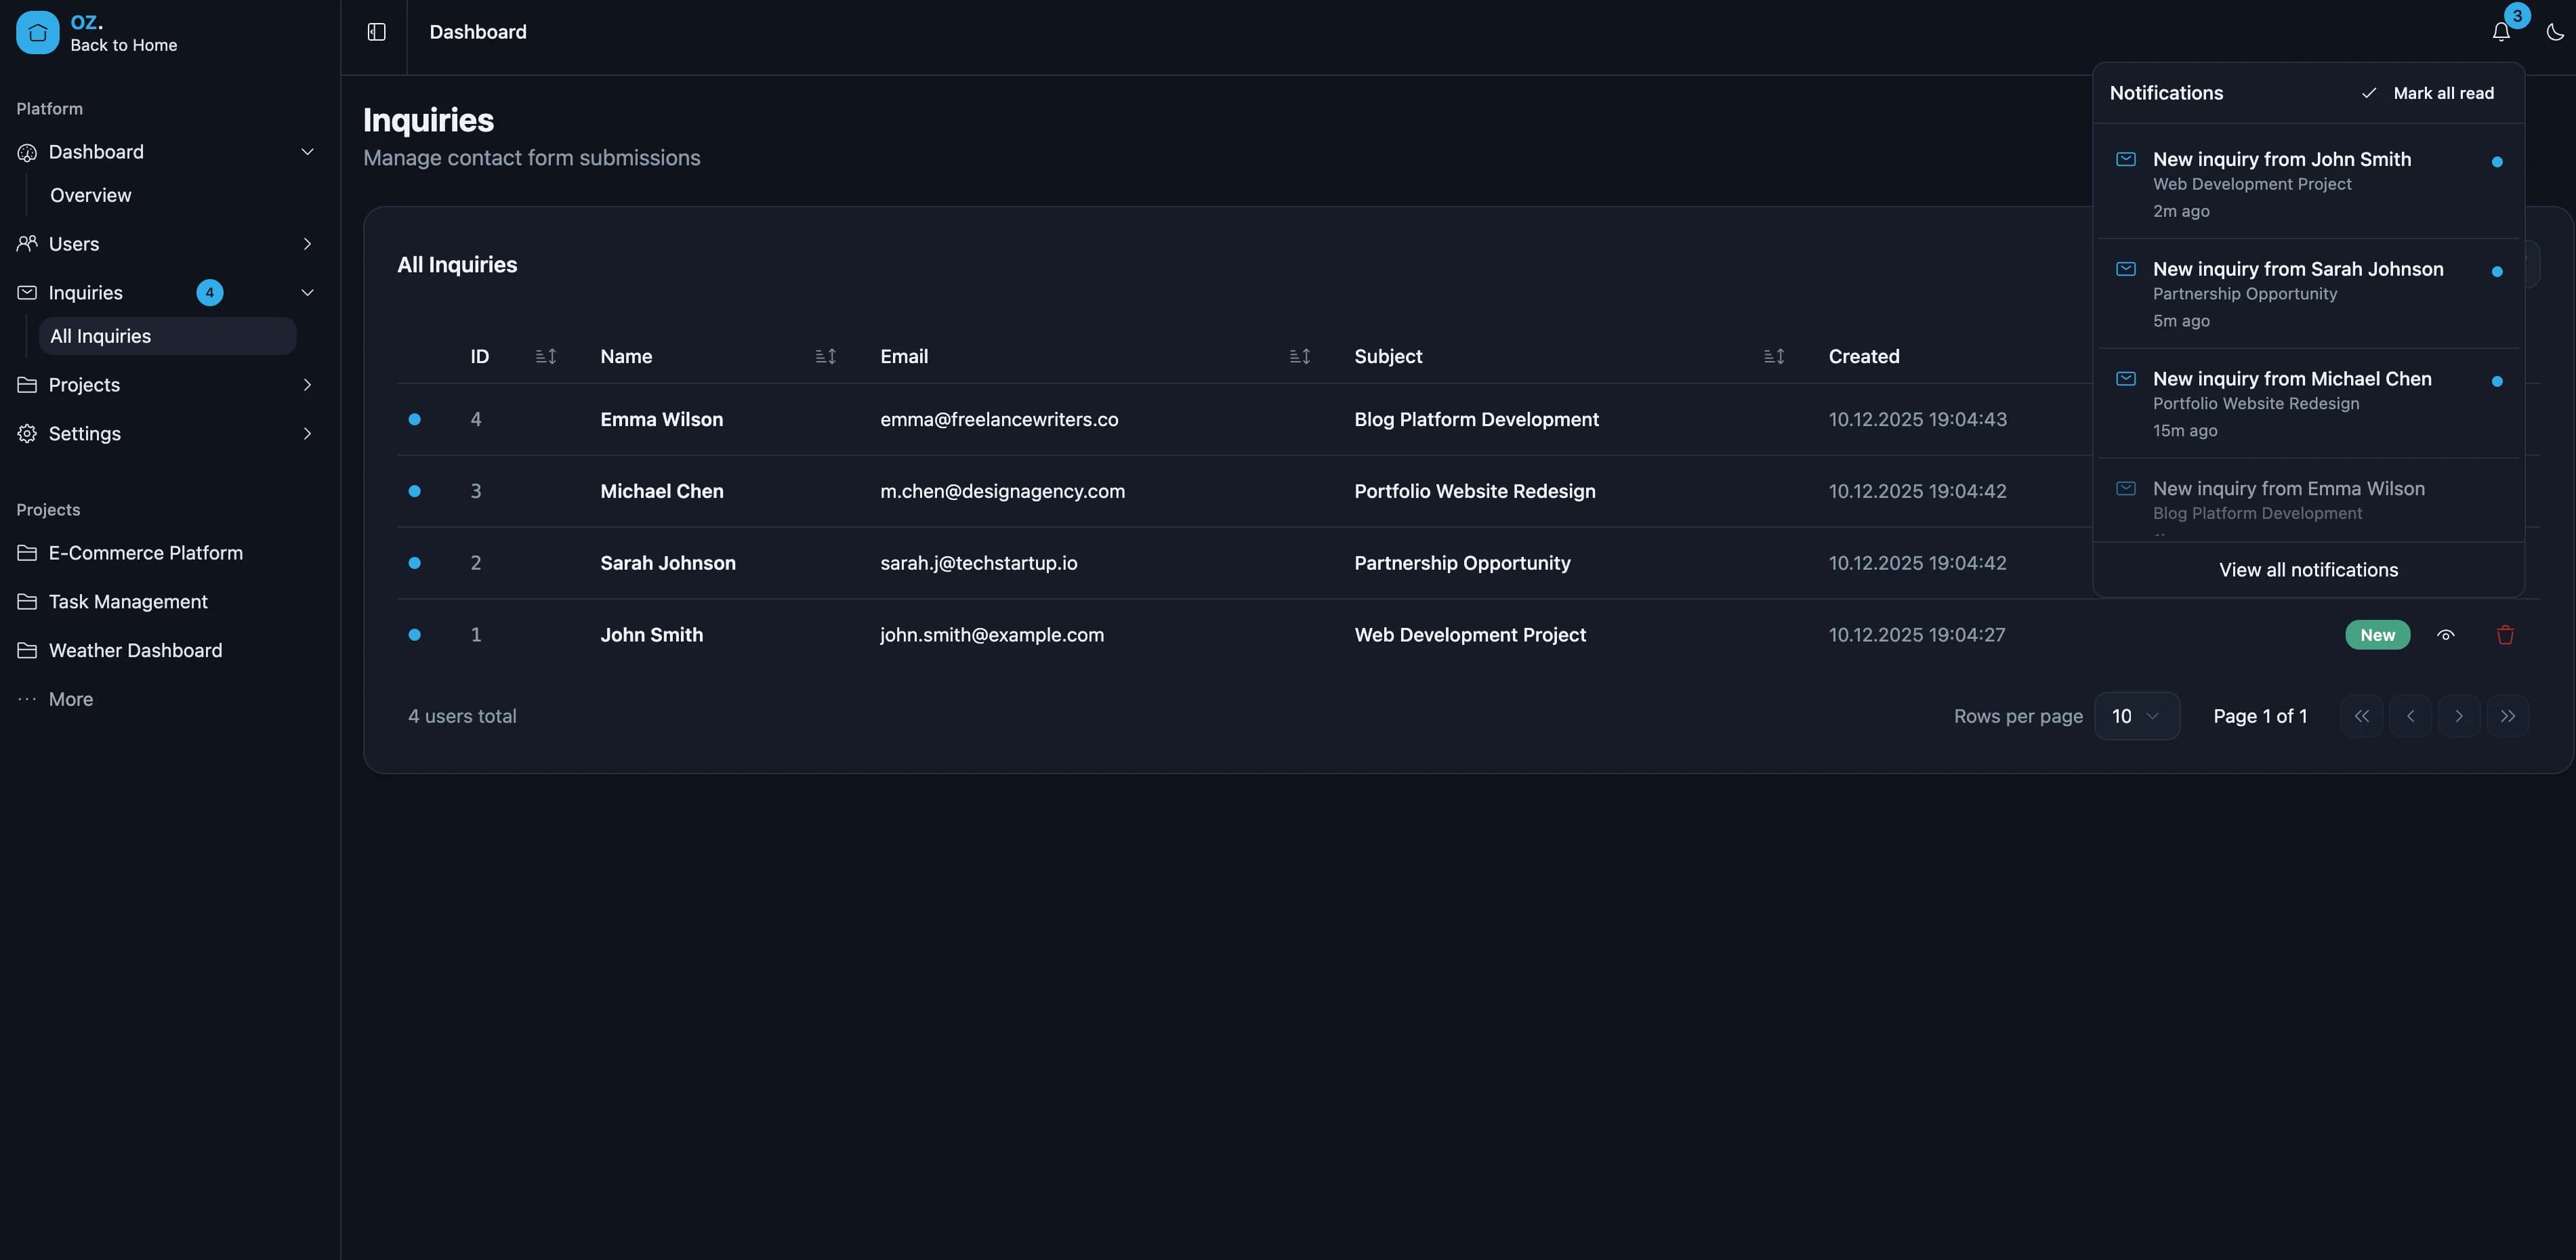
Real-Time Notifications
The dashboard implements Server-Sent Events (SSE) for real-time notifications. When a new inquiry comes in through the contact form, all logged-in admins receive an instant notification.
// SSE connection with automatic reconnection
useEffect(() => {
  const eventSource = new EventSource("/api/v1/notifications/stream");

  eventSource.onmessage = (event) => {
    const notification = JSON.parse(event.data);
    addNotification(notification);
    toast.info(notification.title);
  };

  return () => eventSource.close();
}, []);
IoT Energy Monitoring
The Go backend subscribes to MQTT topics from a Shelly Pro EM 50A smart meter. Raw readings are processed and stored in TimescaleDB hypertables, then streamed to connected clients.
// MQTT message handler stores readings in TimescaleDB
func (s *Service) handleEnergyReading(msg *paho.Publish) {
    var reading EnergyReading
    json.Unmarshal(msg.Payload, &reading)
    s.db.Create(&reading)
    s.broadcast(reading) // SSE + WebSocket
}
The frontend dashboard shows live power consumption with real-time charts, and the mobile app connects via WebSocket for on-the-go monitoring.
Data Tables
All list views use TanStack Table with:
Table Features
- Server-side pagination
- Column sorting
- Search/filtering
- Row selection
- Skeleton loading states
Background Processing
Image uploads are processed asynchronously using Asynq workers. Uploaded images are converted to WebP format in the background, keeping the API response fast while optimizing storage.
Technical Decisions
Why Go for Backend?
- Excellent performance for API servers
- Strong typing catches errors at compile time
- Simple deployment (single binary)
- Great standard library for HTTP servers
Why TimescaleDB?
- Purpose-built for time-series data on top of PostgreSQL
- Hypertables automatically partition data by time
- Continuous aggregates pre-compute hourly and daily rollups
- Built-in compression reduces storage for historical data
Why MQTT for IoT?
- Industry-standard protocol for IoT devices
- Lightweight publish/subscribe model
- Shelly devices natively support MQTT
- Reliable delivery with QoS levels
Why Feature-Sliced Design?
- Clear boundaries between features prevent spaghetti imports
- Each feature is self-contained with its own UI, model, and API layers
- Scales well as the project grows without increasing complexity
- Easier onboarding - new features follow the same structure
Why Zustand over Redux?
- Minimal boilerplate
- No providers needed
- Built-in persistence middleware
- TypeScript support out of the box
- Tiny bundle size (~1KB)
Why TanStack Form?
- Headless - works with any UI library
- Built-in async validation
- TypeScript-first design
- Integrates well with Zod schemas
Lessons Learned
-
Start with permissions early - Adding RBAC to an existing system is much harder than building it from the start.
-
SSE and WebSocket serve different purposes - SSE works great for one-way server-to-client notifications. WebSocket is needed for bidirectional communication like the mobile energy dashboard. Use each where appropriate.
-
Type safety pays off - The time invested in proper TypeScript types saved countless hours of debugging.
-
TimescaleDB continuous aggregates are a game changer - Pre-computing hourly and daily rollups means dashboard queries stay fast regardless of how much raw data accumulates.
-
Feature-gating with environment variables - The energy monitoring feature is gated behind
ENERGY_ENABLED, making it easy to deploy the same codebase with or without IoT functionality.
What's Next
- Add energy cost calculations and billing period reports
- Push notifications for energy anomalies on the mobile app
- Multi-language support for the portfolio